

AUD/USD ran up with strength since the sell-off lows in March, but a long-term resistance came into play in the July second-half.
The pair has now formed a rising wedge which indicates bearish tendencies; the market participants are considering the chances of a turn in the tide.
The early months of 2020 saw a slump in AUD/USD to a fresh 17-year low, posted in March, and since then had a strong bullish momentum to recover all the losses and to turn mildly positive for the year-to-date.
Significant resistance was in play during this up-move, at 0.7000; the zone also marked the resistance from which the early-year downswing started. The opposition was in the picture during June and tested the strength of the advance until mid-July. Buyers were able to surge past this bastion and pushed up the prices to 0.7185-0.7250.
But, the bullish strength considerably waned after this and resulted in the formation of a rising wedge formation in the AUD/USD charts. The logic behind the bearishness is the comeback of earlier trepidation around such a key resistance by the bulls; this will allow bears to crack the support once the price falls.
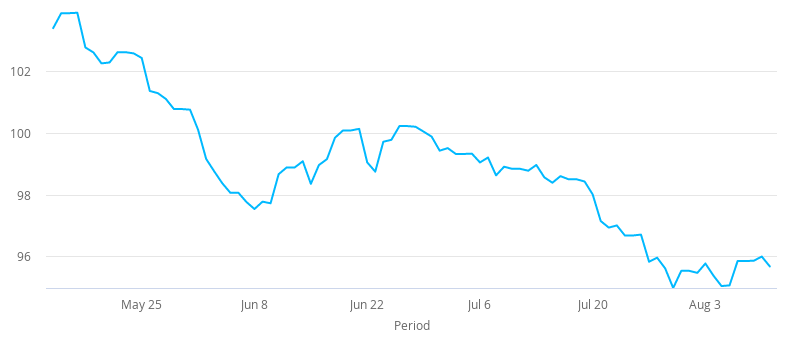
AUD/USD Two-Hour Chart Confirms Weakness
AUD/USD is weak around the 61.8% Fibonacci retracement of the 2001-2011 move, at 0.7185, as seen in the two-hour chart.
This weakness pushes traders’ attention towards the lower-lows emerged recently and the potential for a lower-high if the resistance is not broken in this area. Such a formation can further weaken the bullish case, and the participants will look to the pair to hold below the last week’s swing high around the 0.7242 area. A break in the AUD/USD will see support coming in at 0.7060-0.7072 and then 0.7000.
The latter support is interesting as the earlier strong resistance but one which is failing to lend much help as a support area during the down move.